


Case for Safety
RELATIVE FREQUENCY OF FAILURE MODES
SUMMARY
The H2Safe technology will be most effective in reducing the consequences of leaks through holes in vessels (tanks) and pipelines containing hazardous fluids under pressure, rather than in cases where there is sudden total failure of the containment which releases the entire contents in a few seconds (catastrophic failures). Therefore, in order to assess what proportion of incidents may be made less harmful by the technology a review of worldwide data on the relative likelihood of leaks from holes has been undertaken. This data includes statistical analysis of actual incidents and recommendations from regulators on relative frequencies for use in quantified risk assessment.
The review (covering USA and European sources) concludes that for vessels (including storage tanks, LPG, oil, gas and chemical industries) the historical incident databases and recommendations for risk analysis has concluded that over three quarters of all releases (between 73% and 90%) are from holes (leaks) and only about a quarter or fewer (27%-10%) releases are classified as catastrophic. Therefore a large majority of failures could be mitigated by H2Safe technology.
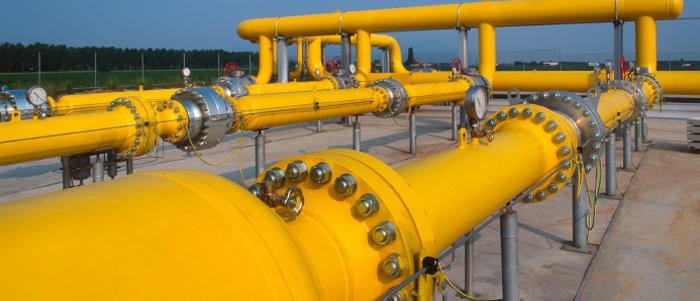
For pipelines carrying high pressure gas the most relevant and comprehensive source of incident data is the European Gas industry record which indicates that over 85% of releases from pipelines are from holes and 15% are from full bore ruptures.
The risk of causing harm to people will be reduced by reducing the range of harmful effects by reducing leakage rates. There are also significant cost reasons for reducing hazard ranges. The cost of damage and disruption from leaks of hazardous materials can be enormous and examples of small leaks igniting and then impinging on other equipment containing large inventories which were released causing several hundred million dollars' worth of damage are listed in the review. The chances of a leak impinging on other equipment may be reduced by reducing the leak flow rate using the H2Safe Technology.
PURPOSE OF THIS TECHNICAL NOTE:
This note has been produced to determine the typical ratio of leaks to total failure in systems designed to contain hazardous substances.
The note also describes some information on the damage arising from pipe and vessel leaks, including the value of property losses (but not the total costs which may also include casualties, environmental damage/clean-up, business interruption and third party costs).
VESSELS
UK HSE Frequencies
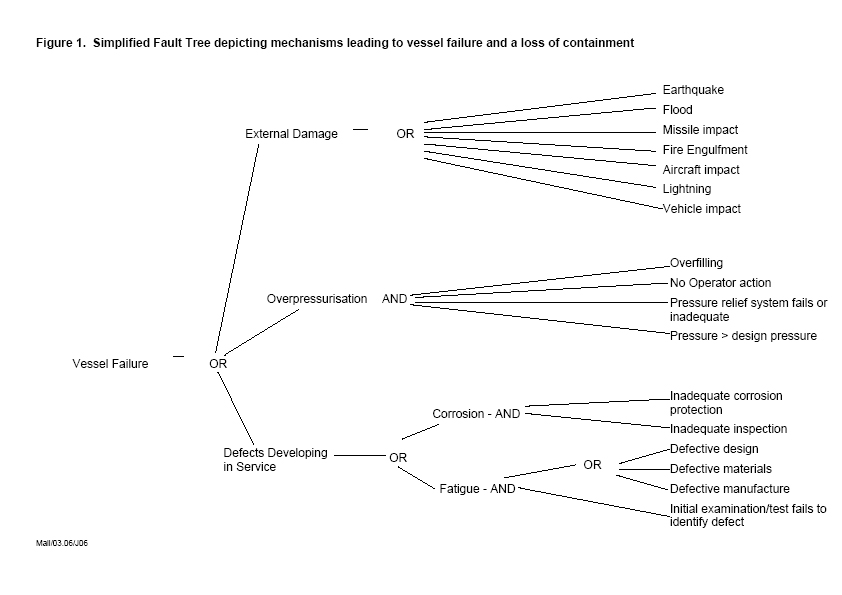
Vessel failures can be characterised a number of ways: Data collection for risk analysis studies usually focuses on the size of a defect or hole using a scale from pinholes to sudden total failure of the vessel shell breaking into two or more fragments. Studies aimed at preventing failures or minimising their consequences require information on the causes of failures as well as the potential size of the release. The UK HSE (Health & Safety Executive) has defined three broad categories of mechanisms causing failure ( Reference 1):
- External Damage
- Over-pressurisation
- Defects developing in service
These are broken down into direct causes in Figure 1 [taken from an HSE Report (Reference 1)].
 Click to enlarge
It is possible to identify further causes, such as over-pressurisation caused by a runaway reaction, or defect growth due to pressure / temperature cycling not detected by monitoring.
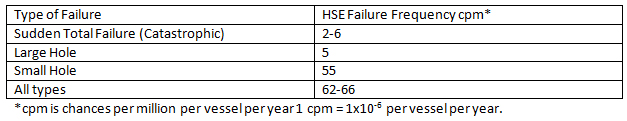
Following a review of HSE data and frequencies used in the Netherlands, HSE has characterised failure rates for pressure vessels in qualitative terms as:
From Table 4 Failure Frequencies for Pressure Vessels
 Click to enlarge
The sudden total failure frequency excludes delayed failure of the vessel due to knock-on from failures in other equipment such as fire impingement from a separate event leading to a BLEVE1.
Therefore the percentage of "small holes" is between 83 and 88% of all failures
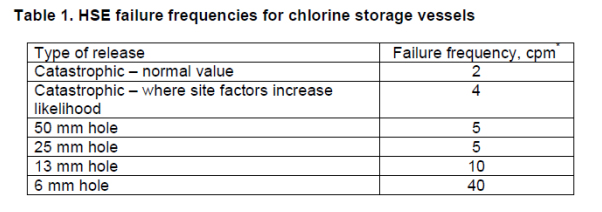
For chlorine pressure vessels HSE has given failure frequencies for particular hole sizes in Table 1 from Reference 1:
 Click to enlarge
*cpm is chances per million per vessel per year 1 cpm = 1x10⁻⁶ per vessel per year.
Therefore the percentage of "small holes" less than 50mm is 86-89%
The HSE Report Reference 1 states later that:
20. No justification has been found for the breakdown of hole sizes for limited failures; it seems purely judgemental but is not dissimiliar to that used by others for QRA. It is obviously influenced by nozzle sizes. The appointment of frequencies to the adopted hole sizes is broadly similar to the declared expectations of the specialist mechanical engineers, taking account of the greater influence of external factors.
The HSE has used the catastrophic (total sudden) failure mode to include all cases where the contents are lost in a very short time, therefore they would include failure of a man-way cover or a very large split in the catastrophic category.
Smith & Warwick (1981) Study [Reference 2 ]
4. Smith and Warwick (1981) consider data from three five-yearly surveys (1962-67; 1968 - 73; and 1973 - 78). Two types of failrures were considered:
a. Catastrophic: this implies a failure so severe to necessitate major repair or replacement.
b. Potentially dangerous: this is a defect requiring action as further operation could result in a dangerous extension of the defect.
5. Over the three periods 216 potentially dangerous failures and 13 catastrophic failures were identified for a population of 20,000 vessels and 310,000 vessel years of experience. For catastrophic failures the data indicate a frequency of 42 cpm with an uppper 95% confidence bound of 70 cpm (Smith and Warwick, 1981). Of the potentially dangerous failures 76 were identified as a result of leakage. 94% of the failures were due to crack propagation, mainly as a result of 'defects existing prior to service' (29%); fatigue (24%); and corrosion (14%).
6. One of the specialist engineers judged that the 42 cpm figure due to Smith and Warwick (1981), reduces to 20 cpm if failures not revelant to the chlorine industry ie creep failures and thick-wall vessels are excluded.
7. HSE judged, for unheated vessels of a high standard, that the catastrophic failure rate would be an order of magnitude lower than Smith and Warwick's (1981) 42 cpm value ie ~ 4 cpm. For stress relieved vessels one of the specialist engineers judged the failure frequency to be about 2 cpm and for non-stressed-relieved vessels to e about 6 cpm.
8. A study funded by HSE of a chlorine site by SRD based on fault tree analysis indicated a failure frequency of 41 cpm, but HSE regarded this as "over-conservative".
9. In a joint study with ICI in the early 1980s (82-85) HSE adopted a catastrophic failure frequency of 2 cpm. This is said to be a 'best estimate' value for the particular ICI plant. ICI adopted 1 cpm.
11. The Smith and Warwick data indicate that 90-95% of pressure vessel failures were due to cracking; of these 30-35% were detected by leakage; 6% led to 'catastrophic' failure; the remainder were discovered during routine inspection. In the case of chlorine vessels cracks in welds could grow due to internal corrosion or by fatigue induced by pressure changes during operation (filling/emptying of vessels).
AMINAL (1994) [Reference 3]
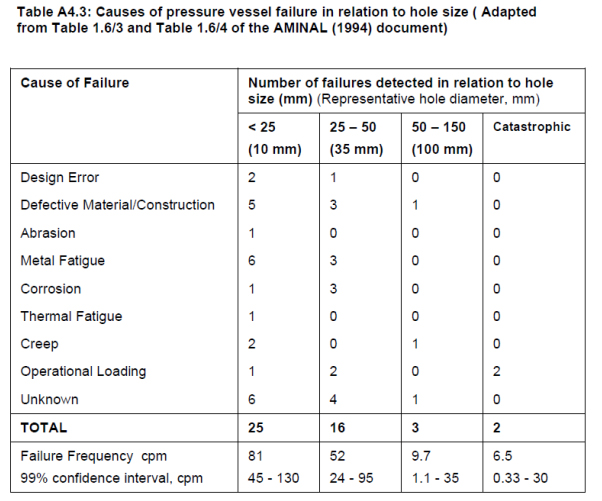
The HSE Report quotes the results (Table 4.3 in AMINAL 1994) of a study relating hole size to cause of failure and frequency (note definition of catastrophic failure here is the one used in the first paragraph above and is therefore narrower than HSE or Smith & Warwick; Smith & Warwick had the broadest definition of catastrophic as their definition would include any loss of containment defect):
 Click to enlarge
Therefore the percentage of "small leaks" less than 50mm is 89%.
J R Taylor (2006) [Reference 4 ]
This study concentrated on loss of containment failures but lists the typical causes of all failures:
- Design errors, including underdimensioning, specification of inadequate materials, specification of wrong welding procedures, overloading of supports and designs in which there are weak points or stress raisers.
- Some pressure vessels require cooling, and multiwall or wound vessel require drains in the walls to protect against leakage - These present special problems.
- Overload, due to too high pressure or temperature, as a result of equipment failures, operation or administrative errors or fire.
- Material faults, welding faults, and faults due to errors in heat treatment.
- Corrosion (especially stress corrosion)
- Corrosion can attack both internally and externally. A frequent cause is improper water treatment, or contamination of water supplies. Stainless steel is especially vulnerable to chloride contamination. For vessels holding liquids other than water high water concentrations are often a problem (e. g. in liquid ammonia).
- Ageing (creep or fatigue)
- Excessive vibration (can cause fatigue or direct overload, usually at flange or weld attachment to vessels.
- Foundation collapse
- Frost heave under foundations (esp. cryogenic tanks)
- Earthquakes
- Crashes (aircraft, ground vehicles, cranes, missiles from explosions.
- Internal explosions and runaway reactions.
- Structural overload of vessels due to external stresses, especially pipe expansion or contraction.
- Liquid expansion when a vessel is completely full of liquid, and is also shut off.
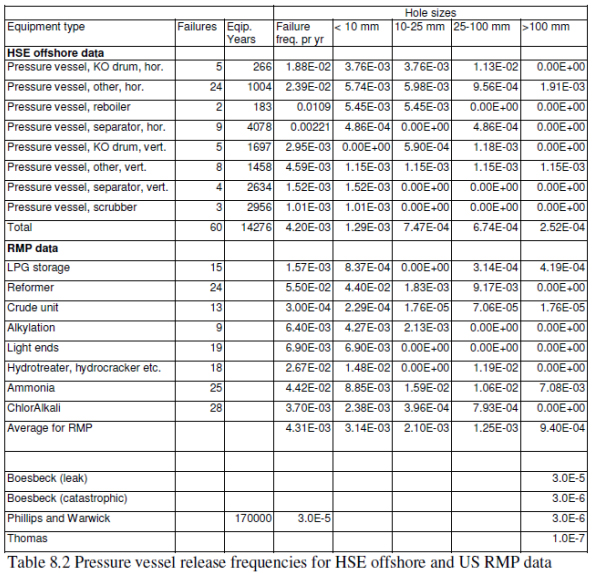
Taylor compared pressure vessel failure data from the UK HSE Offshore Data Base (Reference 5), US RMP data (see Reference 6). Boesbeck (1975) quoted in Lees (Reference 7), Thomas (Reference 8), and Philips & Warwick (Reference 9), giving a breakdown by hole size in the following table:
 Click to enlarge
The RMP data showing that 73% of LPG storage failures are less than 100mm and over 80% of other pressure vessel failures are less than 100mm
Taylor reproduces the distribution of causes of vessel failures as given in accident reports; the figure for refineries is shown below:
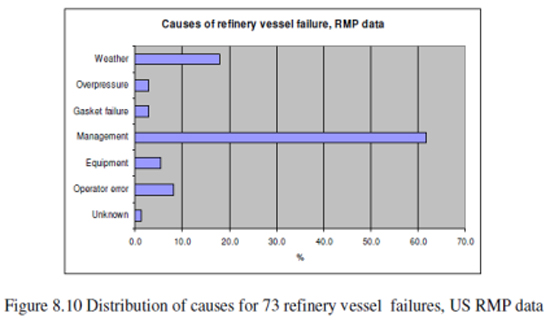
Management failures result in the largest category and these will include failures by management to ensure inspection, testing and maintenance are adequate as well as failure to manage processes such as equipment modification.:
 Click to enlarge
|
 Click to enlarge
|
 Click to enlarge
|
 Click to enlarge
|
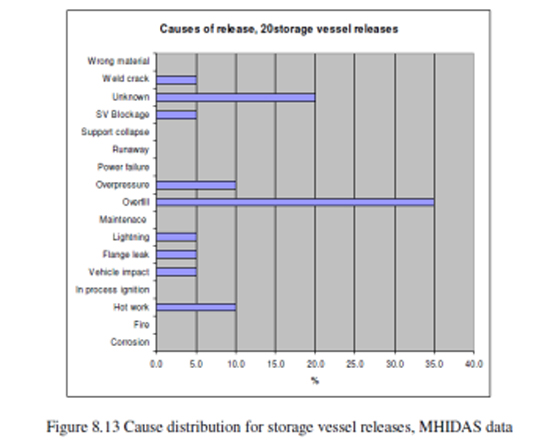
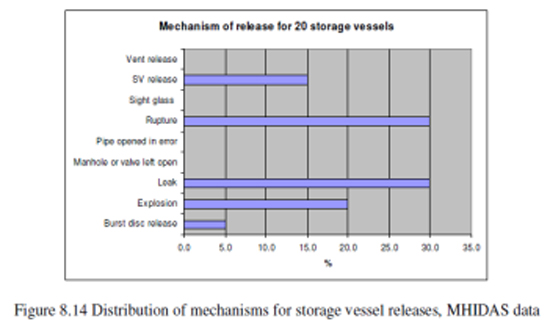
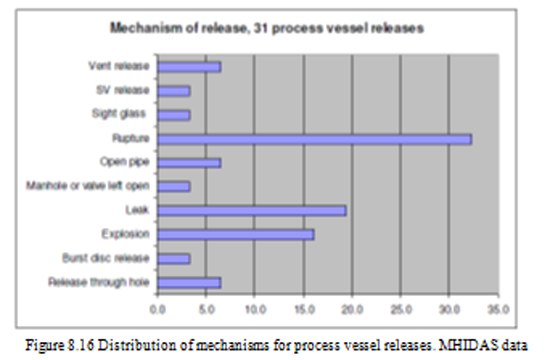
Taylor gives a breakdown of the mechanisms causing process and storage vessel releases derived from the UK Major Hazard Incident Data Service (MHIDAS) records. No frequency can be derived from this information but the proportion of releases from each cause has been calculated in Taylor's charts 8.13 to 8.16. Releases which may be mitigated by reducing the rate of flow through the aperture would be categorised by leaks in Figures 8.14 and 8.16 above (bottom two charts). These represent 30% of releases from storage vessels and 20% of releases from process vessels. The causes that would be mitigated are likely to be corrosion (0%, 6%), weld crack (5%, 6%) for storage and process respectively.
Conclusions for Vessels
Studies of vessel failure and leak frequencies have concentrated on vessels built in steel to pressure vessel design codes.
Previous studies show that between 73% and over 90% of vessel failures are leaks rather than total sudden failures and therefore the hazardous consequences could be reduced by restricting the outflow through the hole.
PIPES – CROSS COUNTRY PIPELINES
EGIG2 - Europe [Reference 10]
This database currently covers over 50% of the gas pipelines in Europe, operating above 15 bar (about 225 psig) and the latest report covers reported incidents from 1970 to 2010. The causes of accidental release are categorised as:
- External Interference
- Corrosion
- Construction Defect/ Material Failure
- Hot Tap Made by Error
- Ground Movement
- Other and Unknown
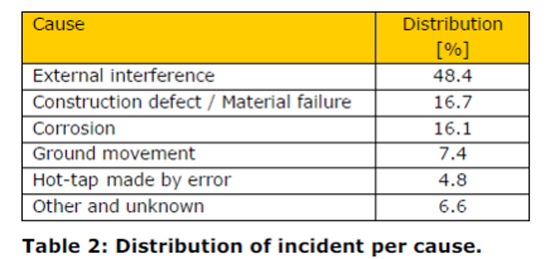
In the last five years the proportion of incidents caused by external interference has reduced and that due to corrosion has increased.
Figure 18 from EGIG shows the distribution of failure size by cause:
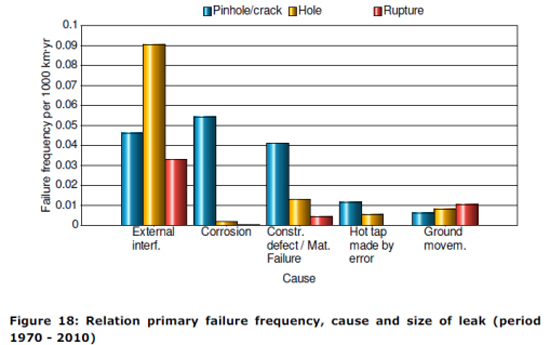
Thus the proportions of failures that are holes or pinholes for each cause are :
|
|
81% |
|
|
98% |
|
|
93% |
|
|
100% |
|
|
54% |
Although some of the holes included in EGIG may be large (it is not precisely defined as an equivalent diameter) the proportion of pinholes is greater than 50% for most cases, and 49% overall:
|
|
27% |
|
|
95% |
|
|
72% |
|
|
69% |
|
|
21% |
Thus small leaks constitute the majority of high pressure gas pipeline releases in Europe.
OPS (Office of Pipeline Safety – US) (Reference 11)
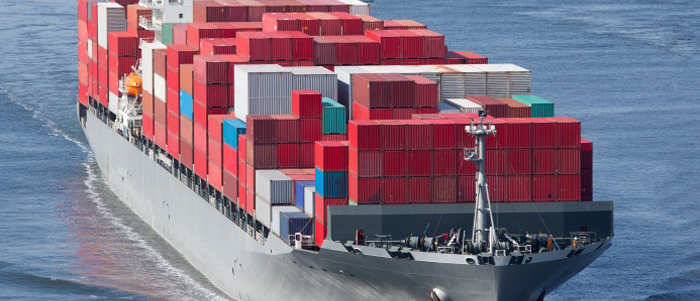
Data on the frequency of hazardous material releases and the relative size of each incident are not readily available although individual accident reports are published. Summary data indicates that the majority of hazardous material incidents in the USA were related to highway transport and resulted in a total damage of over $48 million in 2012 with 10 fatalities and 123 injuries.
PURPLE BOOK3 Manual for Quantitative Risk Assessment – The Netherlands) [Reference 12]
This publication does not give statistics from actual incidents but is a synthesis of experience from a variety of sources. The failure frequencies given in this book are to be used in risk assessments for Regulatory purposes in The Netherlands and are widely followed. In this manual Table 3.3 of thePurple Book indicates that 90% of failures of pressure vessels, reactors or other process vessels (and Table 3.5 of the Purple Book for single skin storage tanks) will be small holes less than 10mm in diameter. Table 3.7 of the Purple Book states that leaks (hole 10% of nominal diameter or less) comprise more than 65% of releases from pipelines.
COSTS
Costs of leaks from pipes or vessels can be extreme – Marsh's 100 largest losses (2012) [Reference 13] lists several (involving gas releases from leaks, not ruptures nor vent / relief valve releases, which may have been mitigated by H2Safe technology being used to reduce release rates):

The recent jet fire incident at San Bruno, California (September 2010) resulted in 8 deaths, 58 injuries and estimate losses of $1.6 billion (University of Delaware, Disaster Research Center, http://udspace.udel.edu/handle/19716/11337 )
The National Conference of State Legislatures has published costs of gas pipelines incidents at http://www.ncsl.org/issues-research/energyhome/state-gas-pipelines-pipeline-accidents.aspx for the decade 2000-2009 (Reference 14. These will include a high proportion of pipeline rupture incidents which would not have been mitigated by H2Safe Technology.
Although pipeline incidents have decreased, measures of risk—an increase in overall population, energy consumption and pipeline mileage—have risen. PHMSA defines a serious incident as an event involving a fatality or injury requiring in-patient hospitalization. During the last two decades, pipeline incidents involving death declined 50 percent, (Reference 15) but 1,087 serious pipeline incidents occurred. Ninety-one percent were related to gas pipelines; of these, 78 percent were related to gas distribution lines.
Significant incidents—a subset of serious incidents—incur consequences such as fatality or injury requiring in-patient hospitalization, $50,000 or more in total costs (1984 dollars), or liquid release resulting in a fire or explosion. During the last 20 years, 364 fatalities and 3,406 injuries occurred.
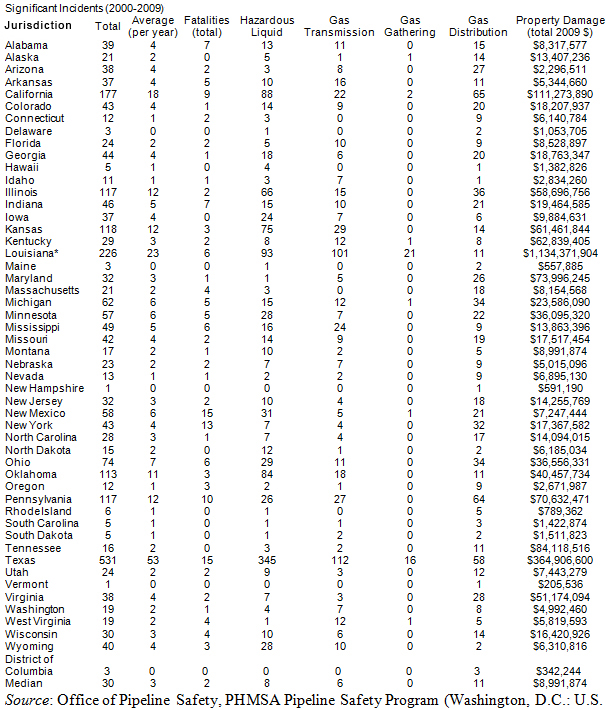
To see significant incident data (2000-2009) by state including total number of incidents, average per year, total number of fatalities, distribution of incidents by type of pipeline and total resulting property damage, please visit this chart. Louisiana data may appear abnormal due to incidents related to Hurricane Katrina.
Federal reporting standards are similar throughout the United States and, although states do not submit reports to PHMSA or OPS, pipeline operators report incidents directly. As pipeline mileage increases, so do accidents; however, the number of significant incidents in some states were more than double that of other states with comparable gas pipeline mileage. The total number of significant incidents that occurred from 2000-2009 ranged from 1 in New Hampshire to 531 in Texas with a median of 30. The data do not reflect pipeline mileage differences between states, however. The next section, Natural Gas as an Expanding Industry, explores key variations and relationships between incidents and pipeline mileage.
 Click to enlarge
Department of Transportation, n.d.); http://primis.phmsa.dot.gov/comm/. Notes:
1) PHMSA defines significant incidents as those reported by pipeline operators with the following conditions:
a) fatality or injury requiring in-patient hospitalization;
b) $50,000 or more in total costs (1984 dollars);
c) highly volatile liquid releases of five or more barrels or other liquid releases of 50 barrels
or more;
d) liquid release results in fire or
explosion.
Significant incidents include all serious incidents
POST SCRIPT
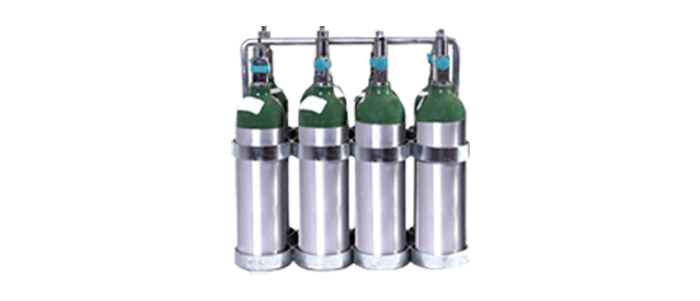
The gas does not need to be flammable to have accident potential. It should be remembered that pipelines or storage vessels containing pressurised vapour hold a considerable amount of energy which can give rise to serious hazards as witnessed by this story from Oklahoma State University http://www.ehs.okstate.edu/modules/cylinder/Theone_story.htm

The anchoring of compressed gas cylinders, to keep them from being knocked over with the accompanying possibility of breaking off the valve, is an accepted safe practice. However there has been some skepticism as to what would happen if a cylinder valve was knocked off.
While it wasn't asked for, we now have first-hand knowledge as to what happened in one case, thanks to a compressed gas cylinder (CO2) that caused a few moments of frenzied activity in a building under construction.
Six 220-cubic foot cylinders, part of a fire extinguishment system, had been moved away from their wall supports to allow painters to complete the painting of the area. While moving them back into position, it was noticed that one cylinder was leaking. The painter had the cylinder leaning against his shoulder, and was attempting to scoot it across the floor. At this time, the valve separated from the cylinder and was projected backward hitting the side of a stainless steel cabinet.
The man suddenly found himself with a jet-propelled 215 pound piece of steel. He wrestled it to the floor, but was unable to hold it. The cylinder scooted across the floor hitting another cylinder, knocking it over and bending its valve. The cylinder then turned 90 degrees to the right and traveled 20 feet where it struck a painters scaffold causing a painter to fall 7 feet to the floor. After spinning around several times, it traveled back to its approximate starting point, where it struck a wall.
At this point, the cylinder turned 90 degrees to the left and took off lengthwise of the room chasing an electrician in front of it. It crashed into the end wall 40 feet away breaking four concrete blocks. It turned again 90 degrees to the right, scooted through a door opening, still chasing the electrician. The electrician ducked into the next door opening, but the cylinder continued its travel in a straight line for another 60 feet, where it fell into a truck well striking the truck well door. The balance of the cylinder pressure was released as the cylinder spun harmlessly around in the truck well area.
The painter who fell from the scaffold received multiple fractures of his leg.
It is surmized that the cylinder valve had obtained previous damage, and it was a matter of chance that it separated from the cylinder at this particular time.
This incident illustrates what can happen when a valve is separated from a compressed gas cylinder. The one contained pressure of about 900 pounds per square inch, but many cylinders are pressurized to 2200 pounds per square inch. If you have any doubts about the need for anchoring compressed gas cylinders, you might think about the 2200 pounds per square inch and ask yourself, "what if....?"
In preventing the accidental release of compressed gases, all precautions must be taken to avoid dropping, knocking over, rolling or dragging cylinders as well as striking cylinders against each other. This means that it is imperative that all cylinders be stabilized in storage, transportation, and in use.
1Boiling Liquid Expanding Vapour Explosion – a vessel breaks into two or more fragments due to internal pressure from boiling contents and reduced strength of shell when heated by fire.
2European Gas Industries Group
3Publication Series on Dangerous Substances (PGS 3) Guidelines for quantitative risk assessment VROM Netherlands, 1999
REFERENCES
- 1. Failure Frequencies for major failures of high pressure storage vessels at COMAH Sites: A
comparison of data used by HSE and the Netherlands, HSE Report, Clive Nussey 2006
- 2. Smith T.A. and Warwick R.G. The second survey of defects in pressure vessels built to high
standards of construction and its relevance to nuclear primary circuits. Safety and Reliability
Directorate, SRD R30, 1974.
- 3. AM94: Manual of Probability Statistics for drafting of Safety Reports (Published by AMINAL
the Flemish Competent Authority) 1994 [AMINAL Dienst Gevaarlijke Stoffen en Risicobeheer.
Handboek kanscijfers ten behoeve van het opstellen van een veiligheidsrapport. Brussels:
AMINAL, 1994]
- 4.Hazardous Materials Release and Accident Frequencies for Process Plant Volume II Process
Unit Release Frequencies Version 1 Issue 7 September 2006 J.R.Taylor /Taylor Associates
ApS
- 5. Offshore hydrocarbon releases 2001-2008 Prepared by the Health and Safety Laborator y for
the Health and Safety Executive 2008 RR672 [latest statistics published online
http://www.hse.gov.uk/offshore/hydrocarbon.htm ]
- 6. RMP Data (Risk Management Plan) see http://rtknet.ombwatch.org/db/rmp/search
- 7. Lees, F.P. (1996). Loss Prevention in the Process Industries (2nd Edition).Appendix 14.
Elsevier.
- 8. H M Thomas (Pipe and Pressure Vessel Failure Probability, Reliability engineering 2 (1981)
83-124)
- 9. Phillips C.A.G. and Warwick R.G. A survey of defects in pressure vessels built to high
standards of construction and its relevance to nuclear primary circuits. UKAEA AHSB(S) R162,
1969.
- 10. Gas Pipeline Incidents 8th Report of the European Gas Pipeline Incident Data Group
December 2011
- 11. U.S. Department of Transportation Pipeline and Hazardous Materials Safety Program,
Stakeholder Communications, Serious Pipeline Incidents (Washington, D.C.: U.S. DOT, n.d.);
http://primis.phmsa.dot.gov/comm/reports/safety/SerPSI.html?nocache=3828
- 12. Guidelines for quantitative risk assessment, Publication Series on Dangerous Substances
(PGS 3) VROM Netherlands (1999)
- 13. The100 Largest Losses 1972–2011 Large Property Damage Losses In The Hydrocarbon
Industry 22nd Edition Marsh (2012)
- 14. Making State Gas Pipelines Safe and Reliable: An Assessment of State Policy: March 2011 By
Jacquelyn Pless "Pipeline Accidents"
- 15. Cynthia L. Quarterman, U.S. Department of Transportation, Pipeline and Hazardous
Materials Safety Administration, Hearing on Hazardous Liquid Pipeline Safety: Regulated vs.
Unregulated (Washington, D.C.: U.S. DOT, June 2010);
http://testimony.ost.dot.gov/test/quarterman4.pdf.
Peter Waite
MA(Oxon) MSc C Eng C Math FIChemE FIMA MIGEM
Registered Safety & Environmental Professional IChemE
ASTRID Consulting Limited,
(Number 7395319)
1 Chazey Road
Reading, RG4 7DS, UK
peter@astriduk.co.uk
www.astriduk.co.uk